First I needed to install the new Library from the Arduino Manager.
Then I connected my IMU to the Artemis board as seen below.
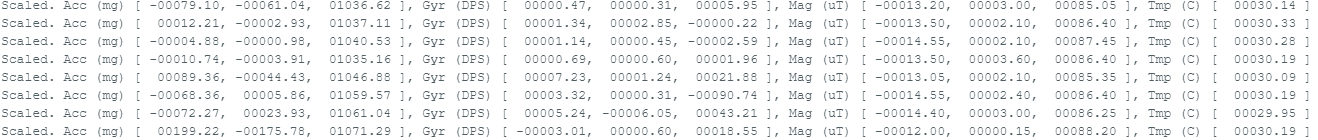
I then ran the example code and saw the following outputs:
AD0_VAL is defined on code line 23 as the default being 1, and when the ADR jumper is closed the value becomes 0.
You can use this value to determine if you have multiple IMUs then which one you explicitly want to receive data from.
I left it at 1 and this allowed me to receive data from the IMU as demontrated above.
I noticed that the Gyr data is measuring the change of the moving IMU in degrees per second.
The acceleration data is outputting values depending on which direction IMU is facing. For instance,
if the IMU is flat on the table the third value is at 1000 but flipping it over reveals a value of -1000.
The other two rotations are also measured in this way where they are 0 if flat on the table but rotate the IMU
to the left or forward then one of the other will go to 1000 depending on the rotation.
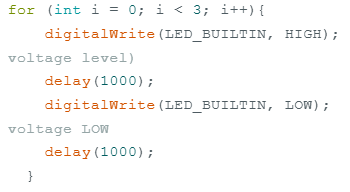
To blink 3 times on start up I added the following code in setup():
Accelerometer
-90, 0, 90 for Pitch / Roll
You can see pitch and roll get to roughly -90, 0, and 90 in the Serial Monitor as screenshotted in the following images.
The equations used for to obtain the accelerometer pitch and roll was as follows respectively:
Accuracy
Over the course of collecting 1000 data points I got the max and minimum pitch and roll over time.
The range of pitch was from -179.498 to 179.044 and for roll was from -179.744 to 179.644. As a result,
the ranges were 358.542 and 359.388 respectively. Given that most of the range was covered, the accelerometer was pretty accurate.
To integrate two point calibrate I would've taken the max in min values revealed above and scaled it to -180 and 180 respectively.
However, I didn't find this necessary since the accuracy appeared very high.
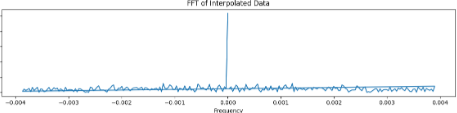
FFT
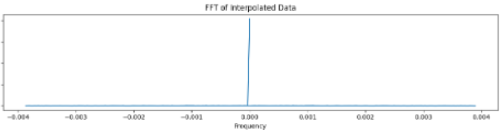
Next, I implemented the FFT and found the following data for pitch and roll respectively:
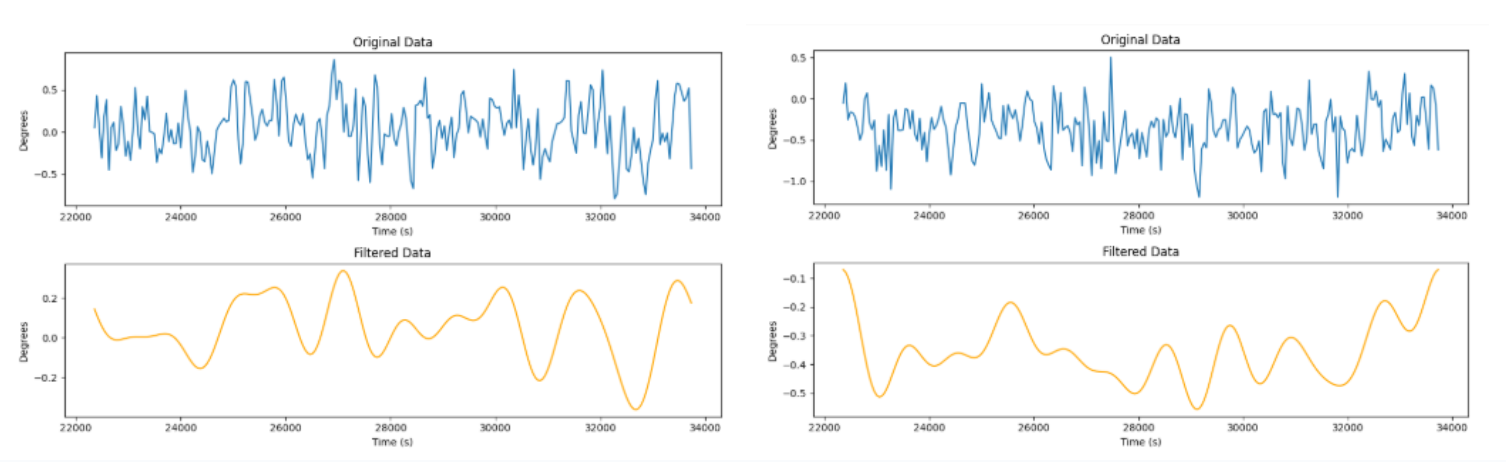
Given these results, I set my cutoff frequency to be .001 and demonstrate the original signal and found the following outputs using a lowpass filter.
The left two graphs are pitch, the right two are roll. Top is unfiltered and bottom is filtered.
Gyroscope
Pitch, Roll, and Yaw for Gyro
Using the equations from class I initialized the variables and then did a for loop as follows to send data to my python code.
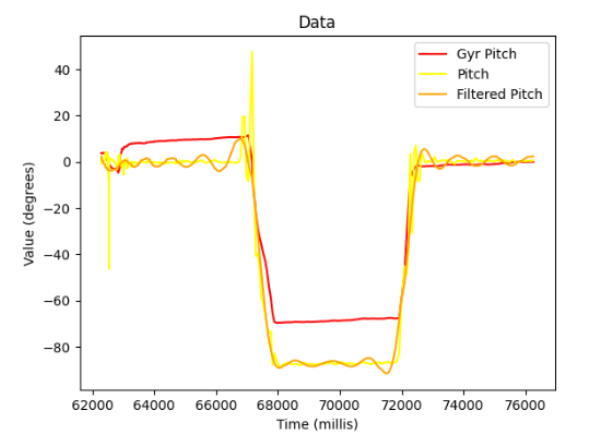
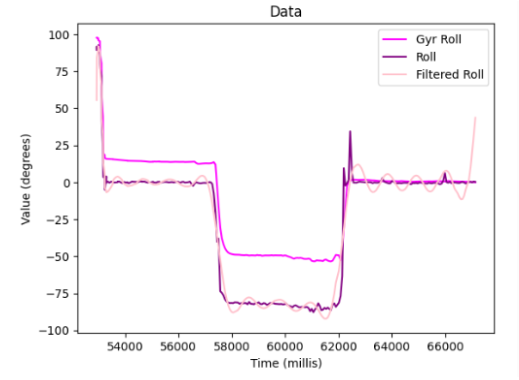
Here are all the outputs graphed from pitch and roll (gyro, accel, and filtered), along with the gyro yaw output.
One can see the gyr outputs match up with the accel outputs.
After introducing a delay, the following observations in the data were made:
One can see in the pitch and roll data that there is more noise with a delay than without one.
This decreases the accuracy because you are missing data between those delays
and since the data gets noisier as a result, its harder to pinpoint the true value.
Complementary Filter
Then I implemented the complementary filter.
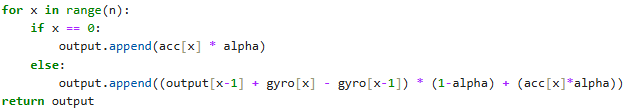
The filter itself was implemented in python as follows:
Where acc and gyro was the data from the accelerometer and gyroscope respectively.
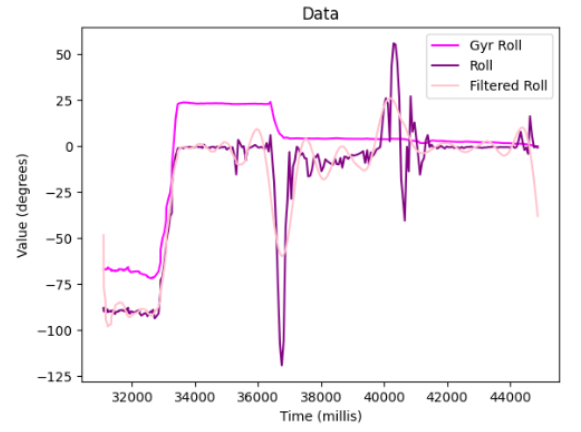
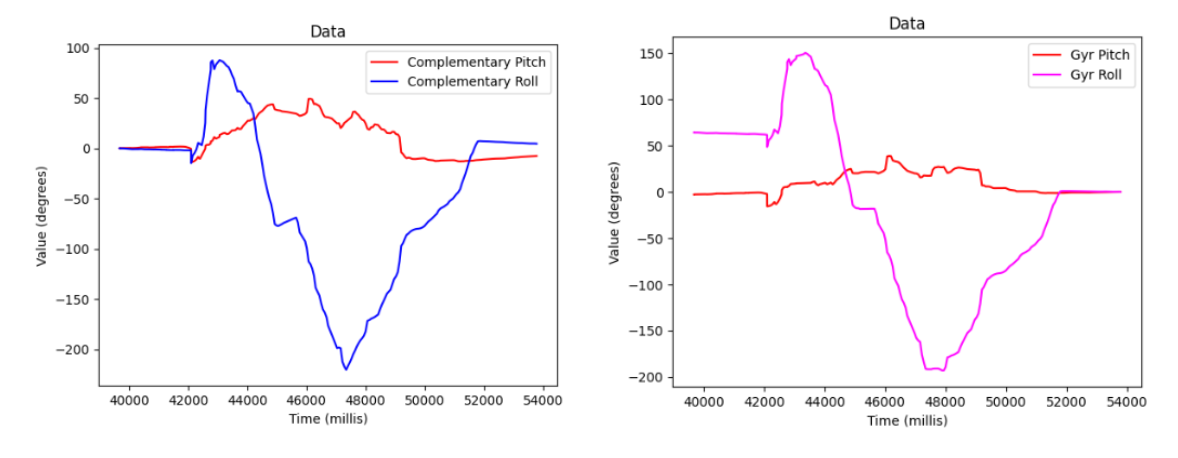
The first below photo demonstrates both accuracy for the complementary filter and range for the roll.
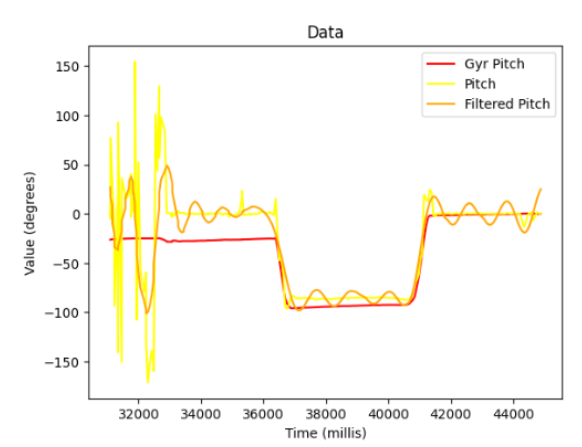
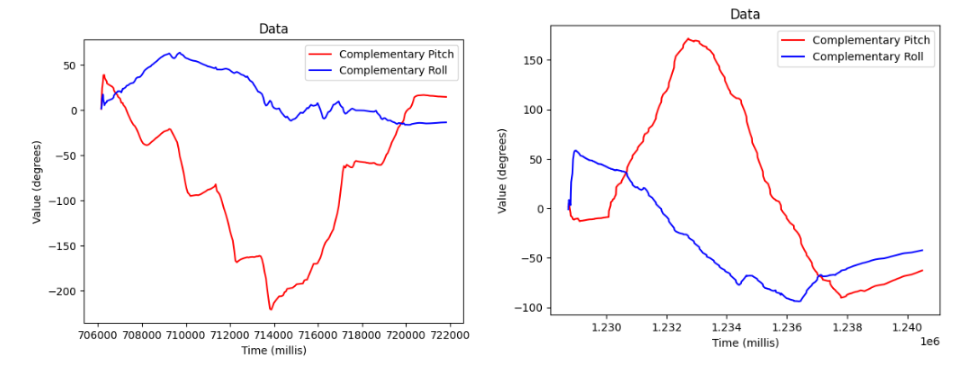
While the photo right after shows that pitch also has large demonstrated range as well.
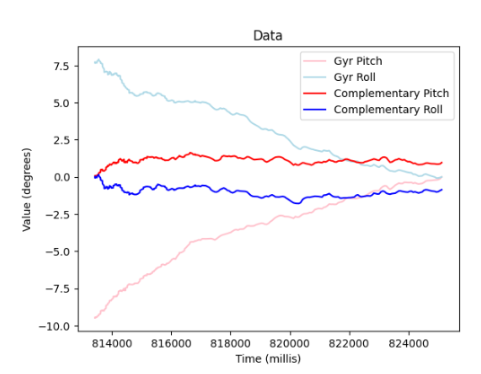
I demonstrate in the following chart how the complementary filter helps prevent drift or quick vibrations.
One can see the gyr pitch and roll drifting but the complementary filter staying consistent despite the vibrations.
Sample Data
Executing Quickly
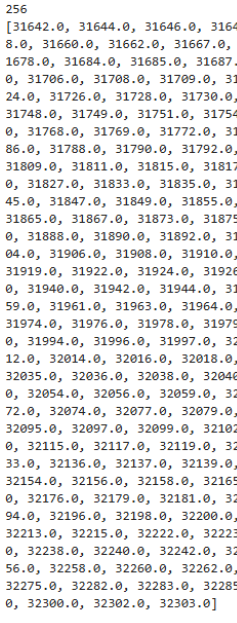
After removing delays and print statements, I was able to sample 256 values in roughly .661 seconds. This was computed
by taking the last time stamp in my array and subtracting the first time stamp.
Using these values I was able to find that it recorded data at roughly 387 values a second.
The first picture shows the length of my array along with the first and last timestamp in milliseconds.
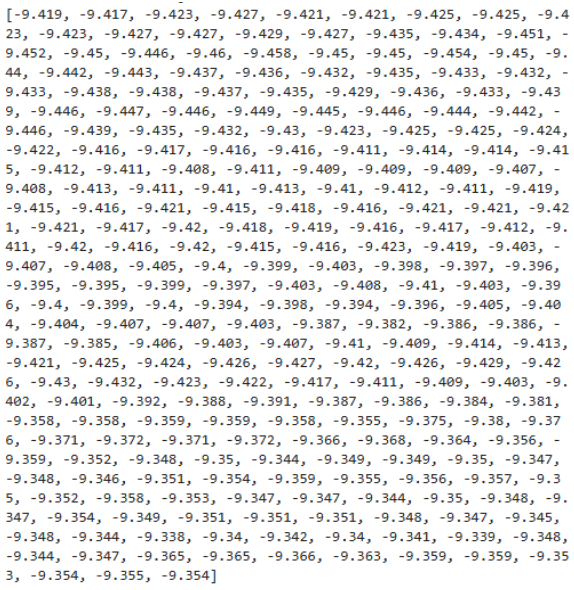
The second picture shows the output for gyryaw, where one can see changes throughout the array. So the IMU still can produce values fast enough for the main loop to process it.
Time-Stamped IMU Arrays
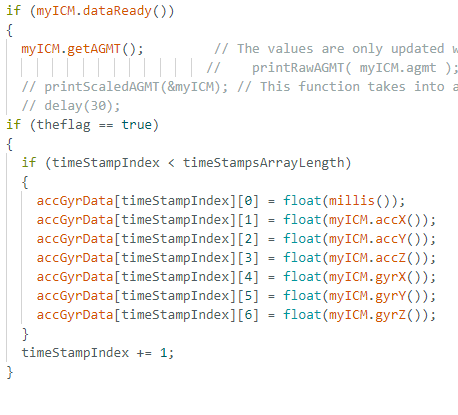
The below is a code snippet of saving the data in an array with a flag
theflag is set via a case that can be called from the python code.
If the case is called it will switch theflag to the opposite value of what it currently is.
I chose to store it in one big array using floats. I chose one big array since it would be less memory overhead since I knew exactly how much data I wanted to extract.
I chose floats because it is the type of data that is collected and since I would be doing math on these values, converting them to a string and then back while doing operations would just add overhead and
changing them to an int would lose precision of the data.
In terms of the maximum amount of memory I could allocate to the arrays.
There are 384 kB of RAM on the artemis. If I allocated 50% of it to the arrays (since 100% would be infeasible since you need memory for other values / operations)
that would give me 192 kB of RAM on the artemis.
A float occupied 4 bytes each and there are 7 floats saved in the array for a total of 28 bytes.
With a sample rate of 387 values per second, I use 10,836 bytes/second. This means I can safely store up to 17.7 seconds of data using just 50% of RAM.
If I were to use all the RAM it would be a little over 35 seconds of RAM.
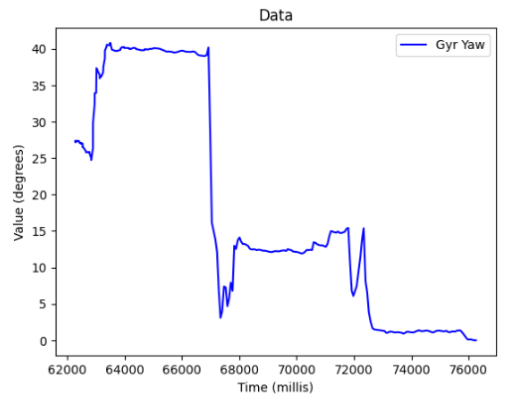
I demonstrate capturing over 5s of IMU data over bluetooth as follows:
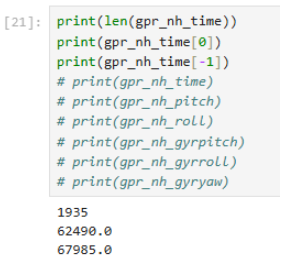
In the picture below, I show the last timestamp as 67985 in millis and the first timestamp as 62490.
Taking the difference, I find that it stored 1935 points of data over the period of 5.495 seconds.
Stunt Time!
Observations
I observed that using the remote had the robot rotate very quickly.
It was difficult to manually determine the angle I would end up with in terms of direction.
Another observation I made was the robot sometimes would go too quickly and start jumping around in place in a funny manner.